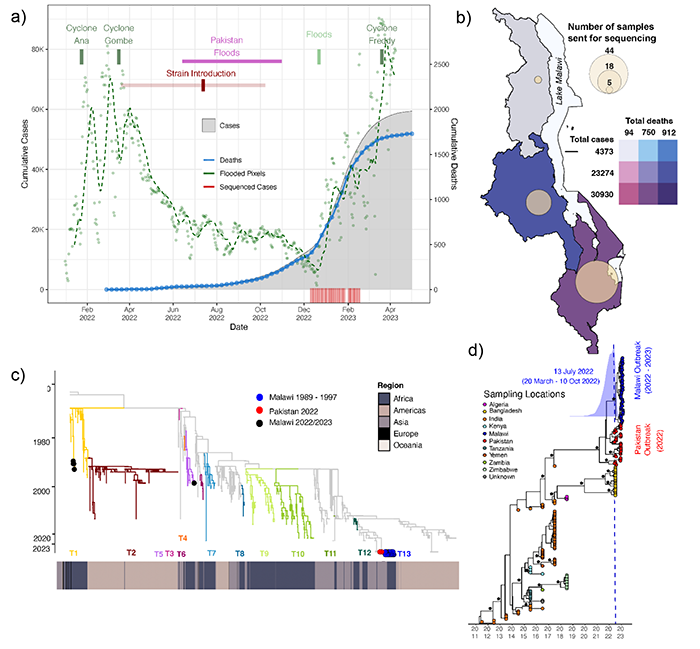
Figure 2: Epidemiological trends of the recent cholera outbreak in Malawi. A) Cumulative number of confirmed cholera cases and deaths are depicted on the y-axes from February 2022 to April 2023. Green dots portray the daily number of pixels demonstrating flooding conditions across Malawi as detected from remotely sensed satellite imagery with the moving average shown as the dashed green line. Inferred time of introduction of a Pakistan strain into Malawi is annotated on the plot as well as the timing of cyclones and flooding events affecting Malawi. Temporal distribution of cases sequenced by this study are displayed as the red rug plot. B) Map showing the total number of cases and deaths for the northern, central, and southern regions of Malawi. Overlayed circles represent the number of samples per region sequenced from the recent outbreak. C) Time-scaled maximum likelihood global phylogeny of all publicly available cholera genomes. Genomes sampled from the 2022 – 2023 Malawi outbreak are displayed as blue circles while genomes sampled from Malawi prior to this outbreak are depicted as black circles. Red circled tips were sampled from Pakistan in 2022. Clade branches are coloured by the previous 12 introduction events involving Africa (T1 – T12) as per Weill et al. (2017). We denote the 2022 – 2023 Malawi genomes as the 13th introduction (T13). Heat map below the tree is coloured by continental region of sample origin. D) Zoom in of the time-resolved phylogeny depicting the clade containing genomes from the 2022 – 2023 outbreak in Malawi in blue (n= 49, sampled between 10 December 2022 and 17 February 2023) with a basal clade of genomes sequenced from Pakistan in 2022 in red. Time to the most common recent ancestor (TMRCA) is estimated at 13 July 2022 (HPD 95%: 20 March – 10 October 2022). The posterior distribution of the TMRCA is shown as the blue curve. Bootstrap support values >0.9 are displayed with asterisks. Figure adapted from Chabuka et al. https://www.medrxiv.org/content/10.1101/2023.08.22.23294324v1.
Click on the image below to go back to CLIMADE COP28 report.


