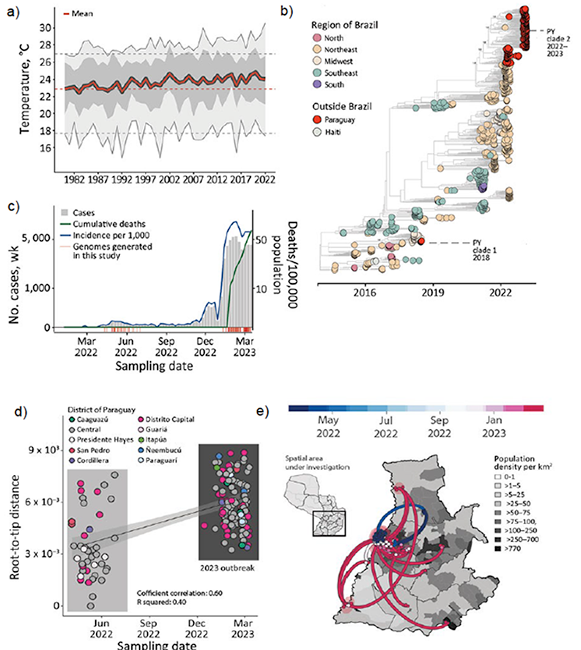
Figure 1. Spatial and temporal distribution of cases of chikungunya in Paraguay. A) Temperature trends during 1981‒2022. Yearly mean (red line), yearly minimum and maximum (light gray shading), yearly 50% quantiles (dark gray shading), minimum and maximum temperatures in 1981 (dashed gray lines) and mean temperature in 1981 (dashed red line) are shown. B) Number of chikungunya virus genome sequences in Paraguay compared with Brazil (by region) and Haiti. Size of circles indicates number of new genomes generated in this study. C) Weekly reported chikungunya cases (gray area), incidence normalized per 100,000 persons (blue line), and cumulative deaths (green line -or other color if you need to change this line color) during 2022–2023 (through epidemiologic week 11). Red bars indicate dates of sample collection of genomes generated in this study. D) Expansion of the chikungunya East/Central/South/African lineage epidemic in Paraguay. Regression of root-to-tip genetic distances and sampling dates estimated by using TempEst version 1.5.3, (http://tree.bio.ed.ac.uk/software/tempest), buffers (shaded area) representing 90% CIs. Colors indicate geographic location of sampling. E) Spatiotemporal reconstruction of the spread of CHIKV ECSA in Paraguay. Circles represent nodes of the maximum clade credibility phylogeny, colored according to their inferred time of occurrence (scale shown). Shaded areas represent 80% highest posterior density interval and depict uncertainty of the phylogeographic estimates for each node. Solid curved lines indicate links between nodes and directionality of movement. Differences in population density are shown on a gray-white scale.
Figure adapted from Giovanetti (2023) et al. Emerg Infect Dis 2023; 29: 1859–63.
Click on the image below to go back to CLIMADE COP28 report.


