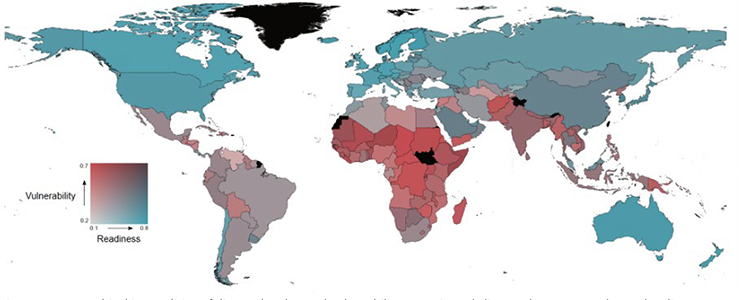
Figure 7: Geographical inequalities of disease burden and vulnerability to projected climate change. Map shows the climate vulnerability and readiness index for 2020 (data retrieved from https://gain.nd.edu/our-work/country-index). Notre Dame Global Adaptive INitiative (ND-GAIN) highlighting that sub-Saharan Africa and parts of South and Southeast Asia are at the dangerous intersection of high vulnerability and low readiness. Index values are not available for countries/regions shaded in black.
Click on the image below to go back to CLIMADE COP28 report.


